Grow premium, not headcount

Win more of the right business with AI-powered submission and triage

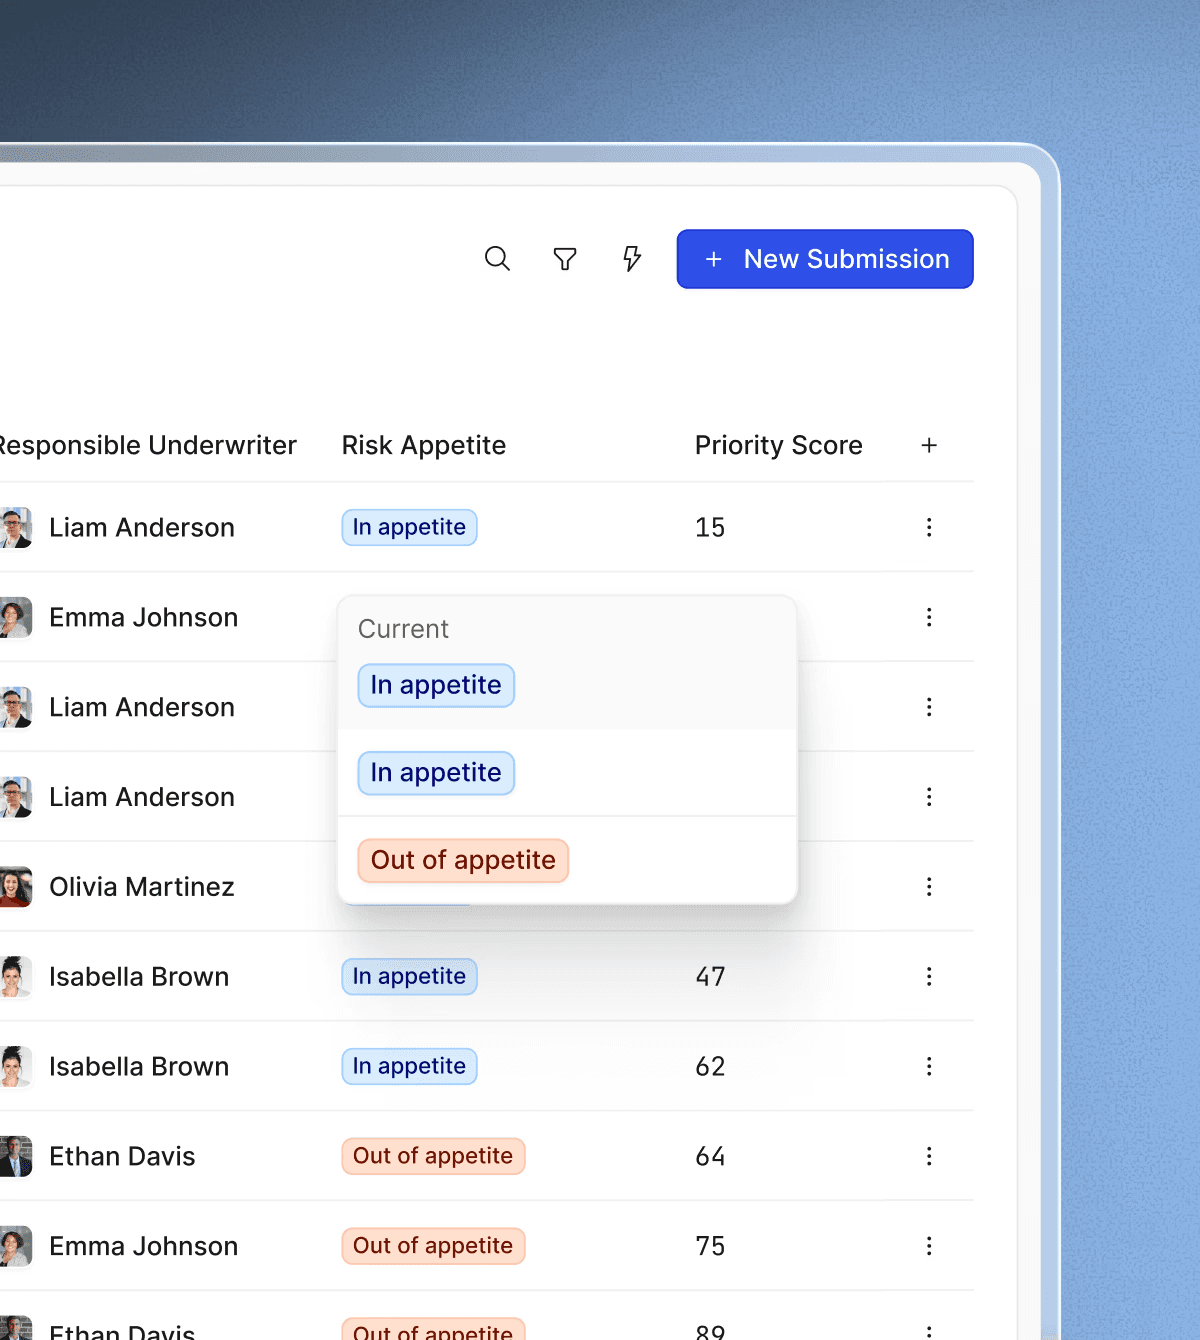
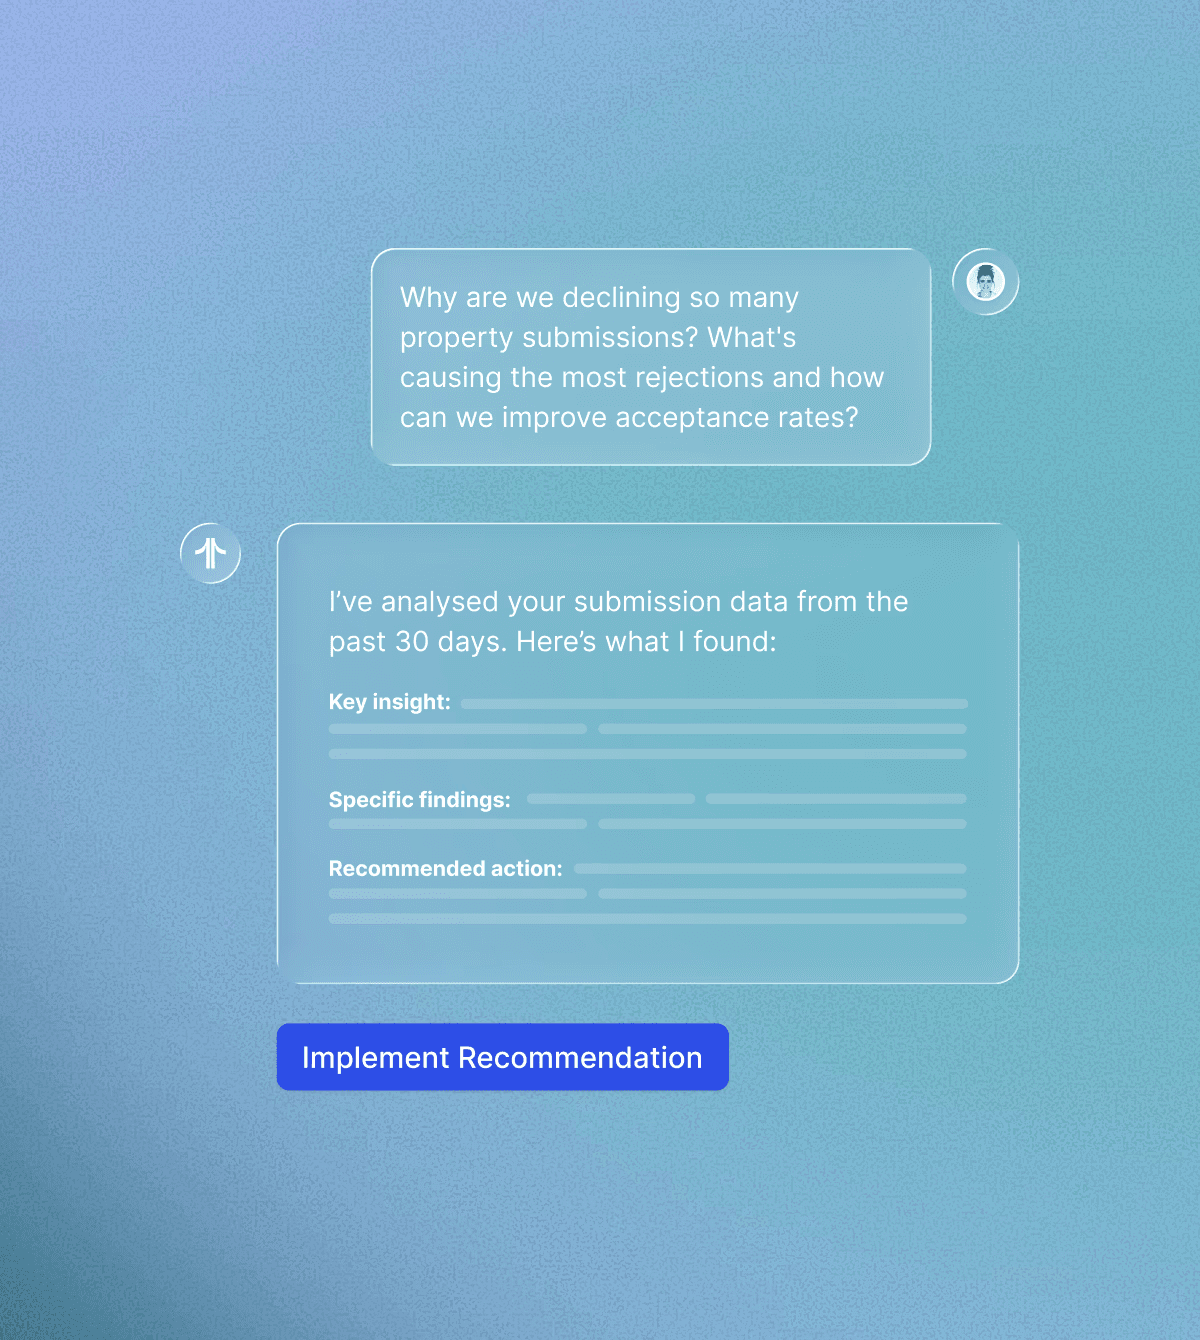
Create an inbox for submissions within my current risk appetite…

A gradient background transitioning from dark blue to light blue, symbolizing innovation.

Create an inbox for submissions within my current risk appetite…

A gradient background transitioning from dark blue to light blue, symbolizing innovation.
  • Faster responses

    Quote in minutes, outpace the competition and win more business

  • Less manual busywork

    Free your underwriting experts to focus on judgements calls

  • Smarter triage decisions

    Target the right risks with triage guided by your models and strategy

The fastest path fromsubmission to quote
No jumplinks detected
  • Soft gradient transitioning from blue to teal, suggesting a modern digital aesthetic.

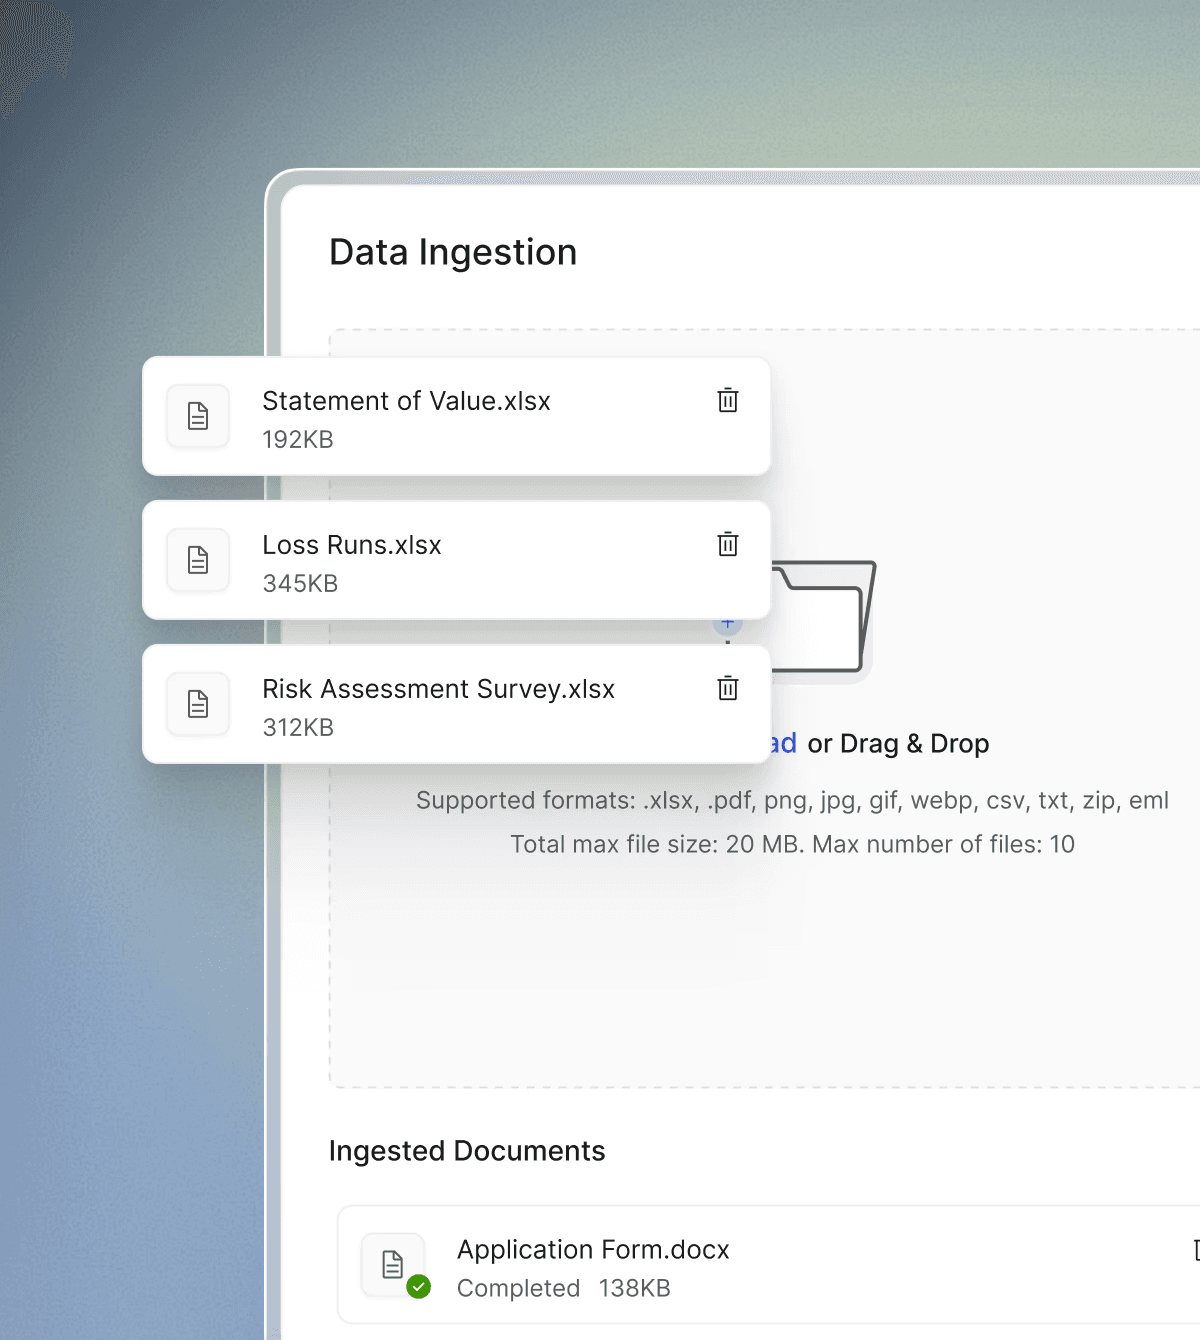
    AI-powered submission intake

    Automatically ingest submissions from Excel, PDF, Word, email, and image sources, converting unstructured data into structured fields ready for triage.

    Reduce manual rekeying and errors at the first touchpoint so underwriters start with complete, reliable information and can move faster from intake to decision.

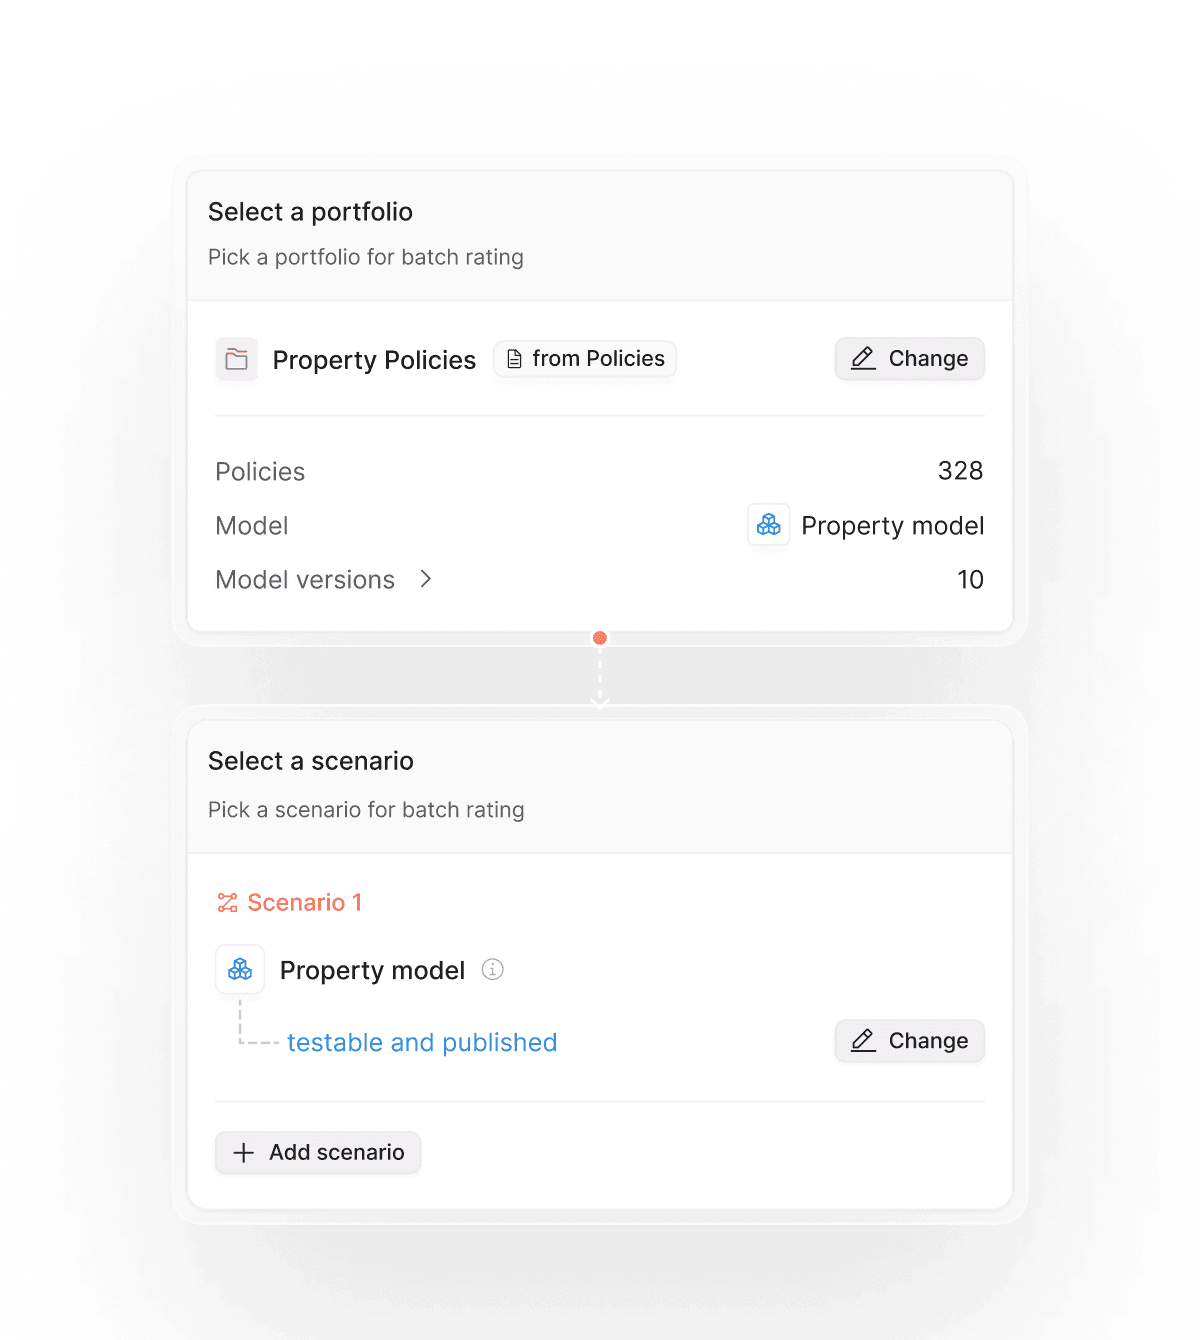
    Portfolio and scenario selection interface for batch rating in insurance software.
    Soft gradient transitioning from blue to teal, suggesting a modern digital aesthetic.

    AI-powered submission intake

    Re-run historic portfolios on new models and proposed rates in a single click to support testing, analysis, and deployment.

    Quickly quantify impact at scale so actuarial and underwriting teams can validate changes before they go live.

    Portfolio and scenario selection interface for batch rating in insurance software.
    Soft gradient transitioning from blue to teal, suggesting a modern digital aesthetic.

    AI-powered submission intake

    Re-run historic portfolios on new models and proposed rates in a single click to support testing, analysis, and deployment.

    Quickly quantify impact at scale so actuarial and underwriting teams can validate changes before they go live.

  • Gradient background transitioning from deep blue to light blue.

    Triage and risk appetite models

    Codify risk appetite rules and underwriting guidelines into configurable models that are easy to maintain as strategy evolves.

    Deploy prioritisation logic of any complexity to consistently route and rank submissions by fit and profitability, ensuring underwriters spend time where it creates the greatest commercial impact.

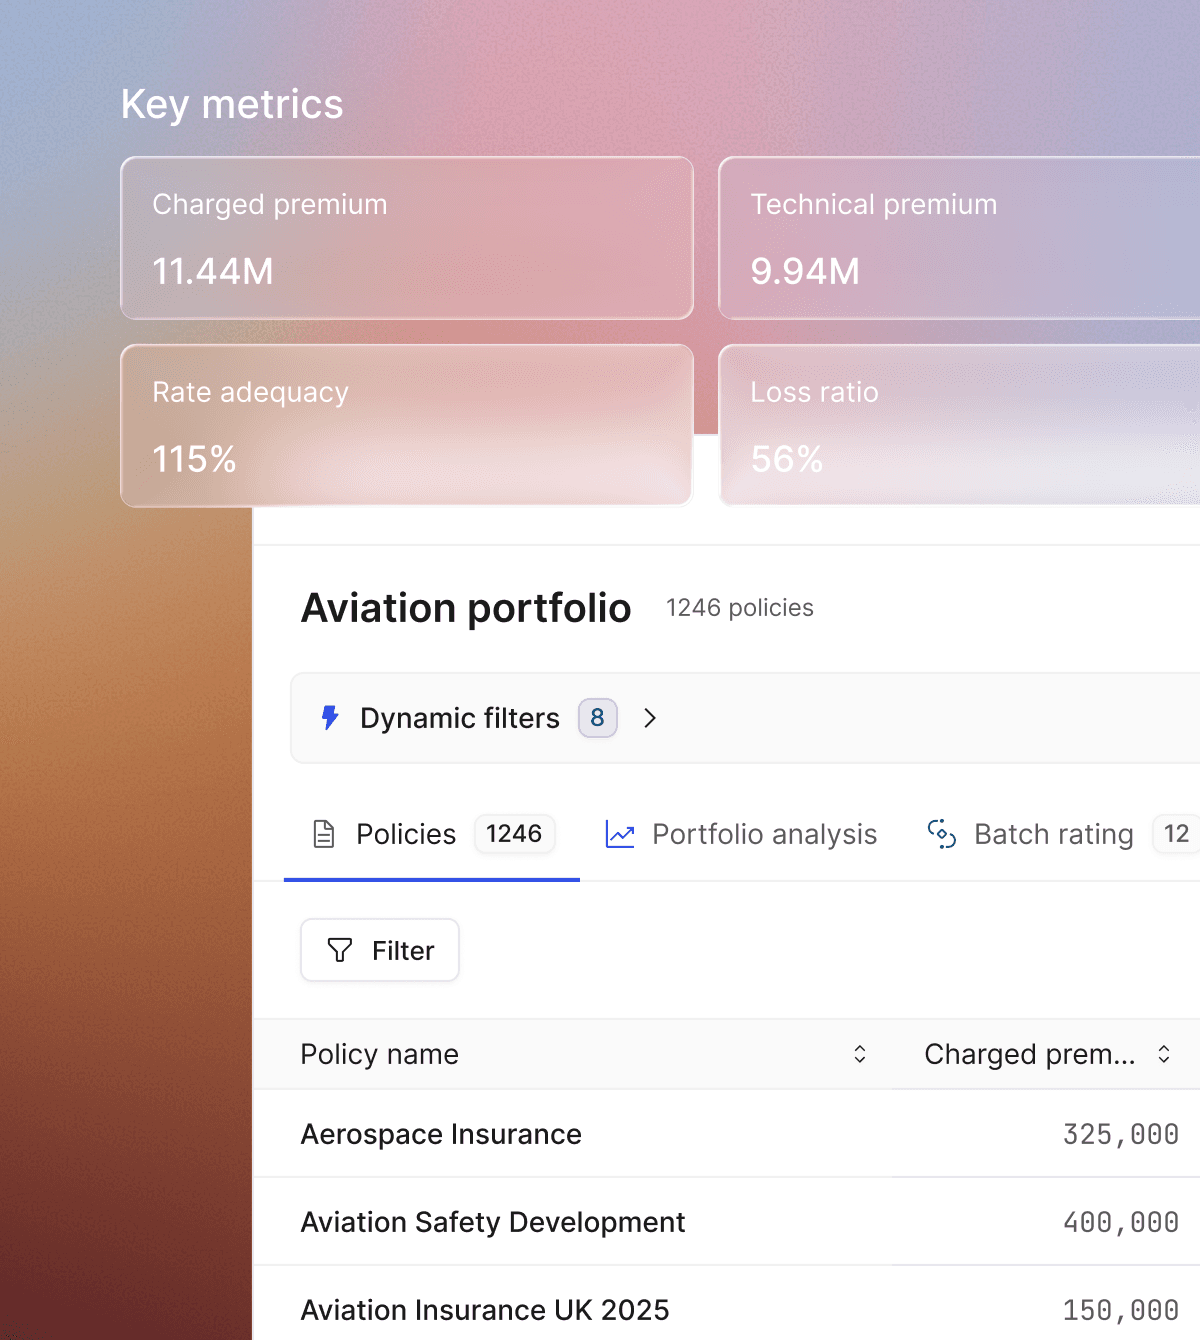
    Dashboard displaying key metrics and details of an aviation insurance portfolio.
    Gradient background transitioning from deep blue to light blue.

    Triage and risk appetite models

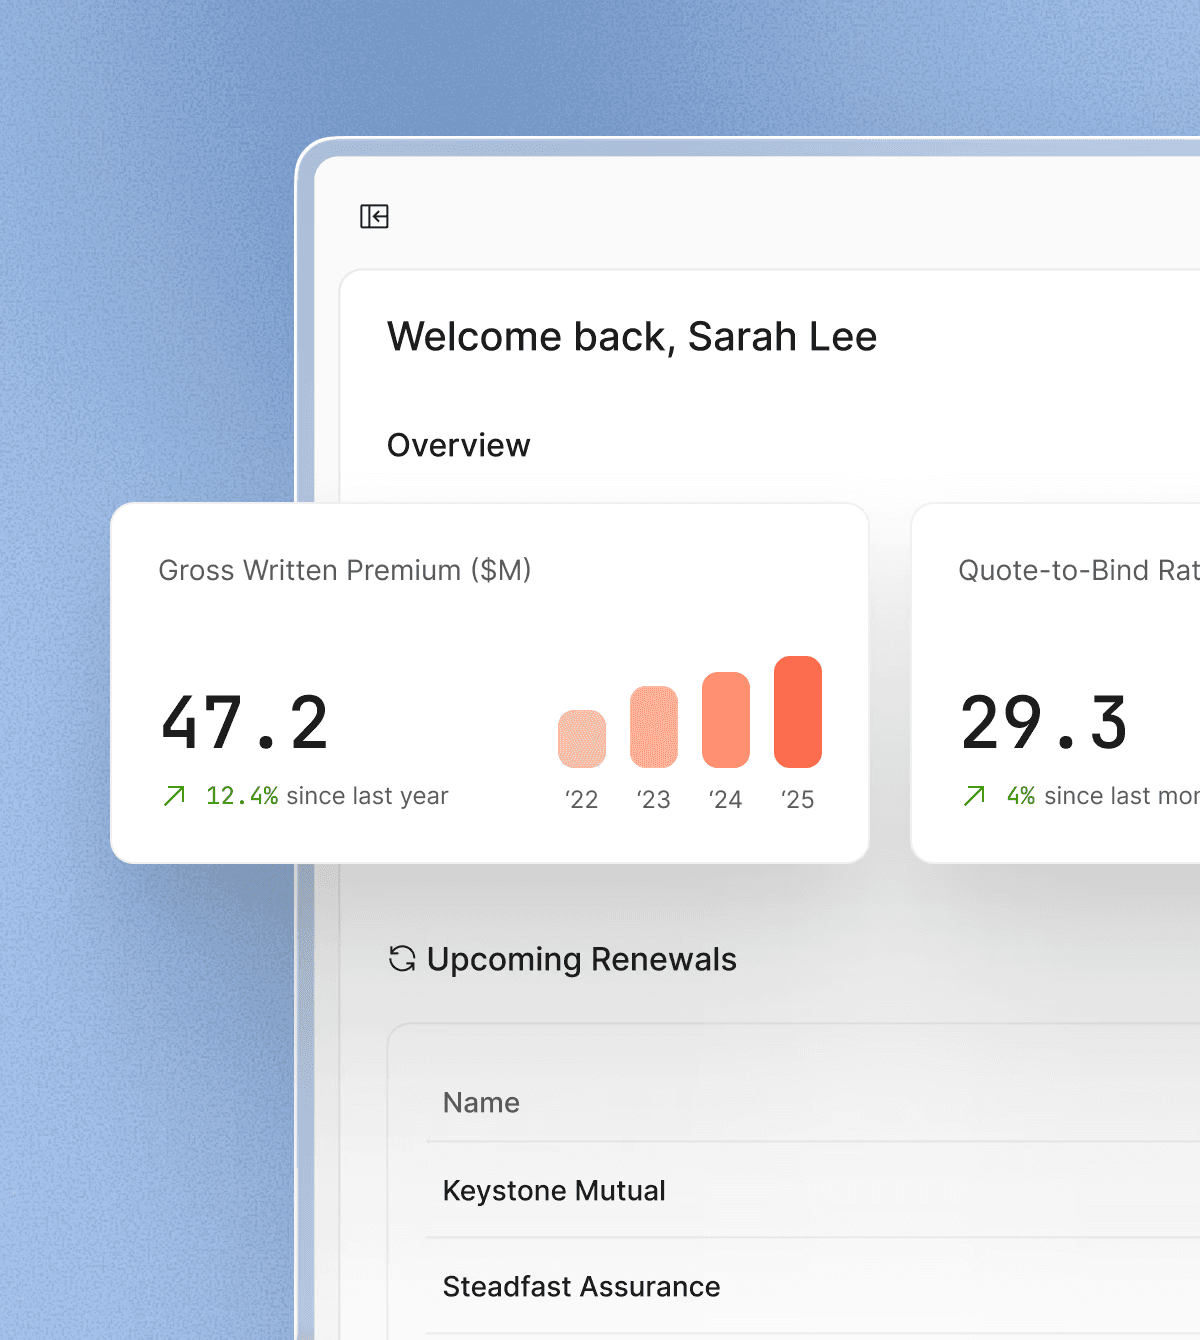
    Unlock actionable insights and KPIs across your underwriting portfolio to track performance and pinpoint improvement opportunities.

    Monitor mix, profitability, and trend movements in one place to guide confident, data-backed decisions.

    Dashboard displaying key metrics and details of an aviation insurance portfolio.
    Gradient background transitioning from deep blue to light blue.

    Triage and risk appetite models

    Unlock actionable insights and KPIs across your underwriting portfolio to track performance and pinpoint improvement opportunities.

    Monitor mix, profitability, and trend movements in one place to guide confident, data-backed decisions.

  • Gradient background transitioning from soft blue to peach, creating a calming effect.

    Indicative pricing

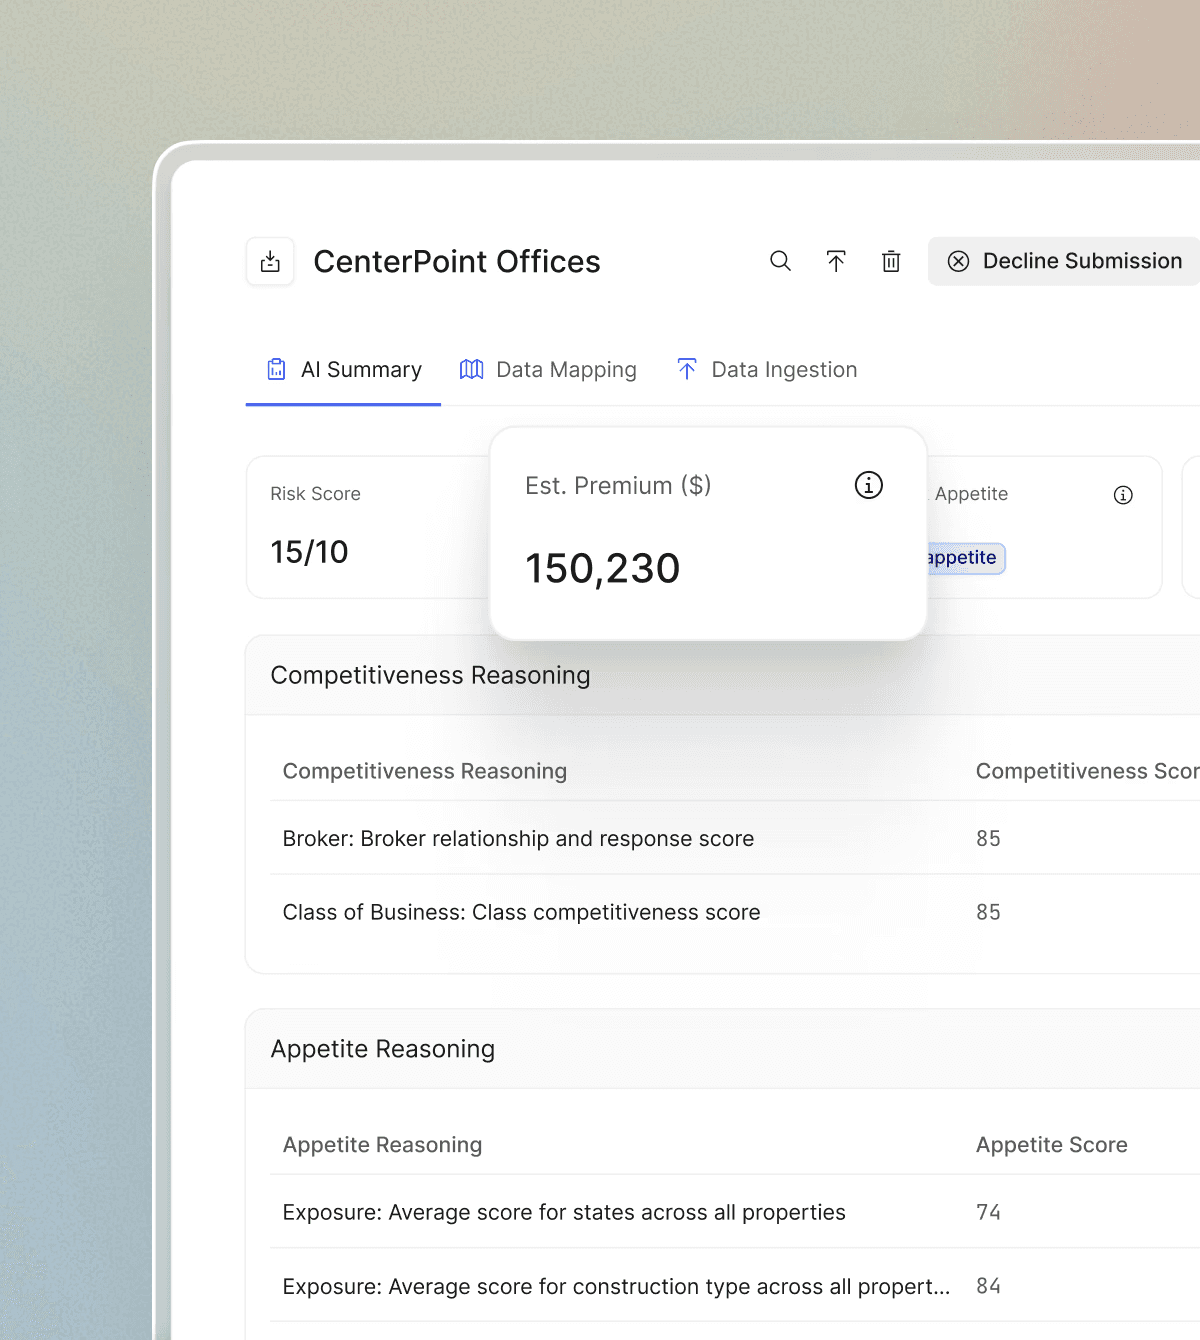
    Provide indicative pricing directly in the underwriter’s initial submission view to support early selection and steering decisions.

    When a risk meets appetite, underwriters can progress into full pricing and deeper analysis in a single click, maintaining momentum from triage through to quote.

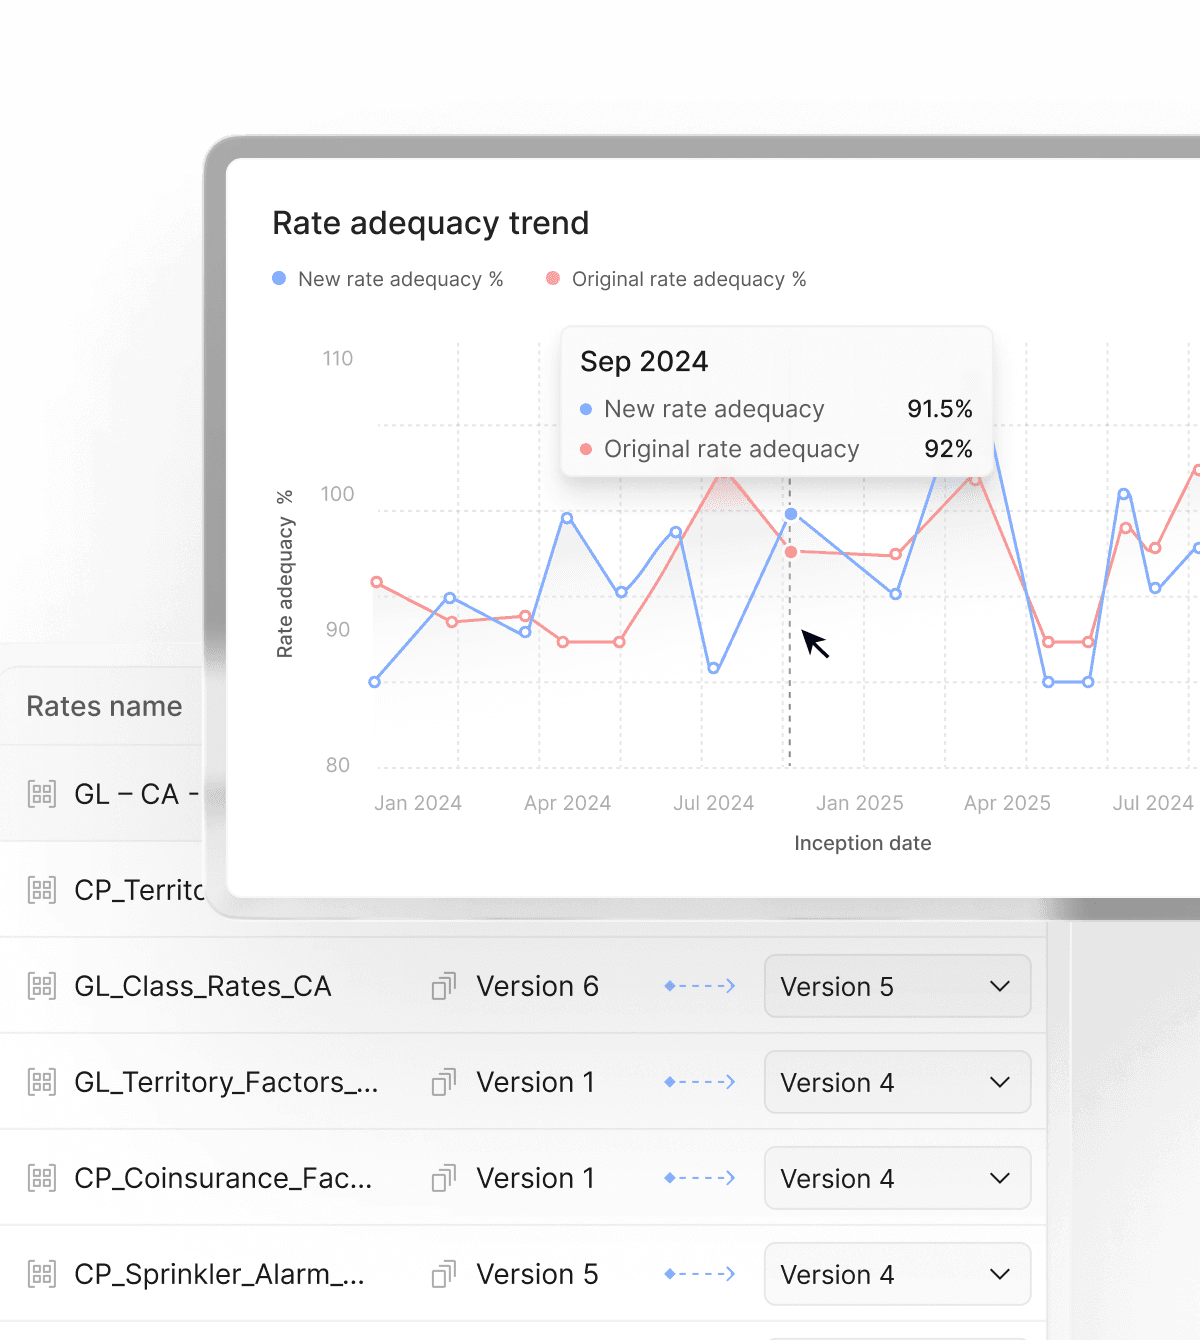
    Line graph comparing new and original rate adequacy percentages over time.
    Gradient background transitioning from soft blue to peach, creating a calming effect.

    Indicative pricing

    Instantly visualize the distributional impact of rate changes across segments to understand who wins, who loses, and why.

    Support strategic planning and regulatory requirements with clear, defensible views of change.

    Line graph comparing new and original rate adequacy percentages over time.
    Gradient background transitioning from soft blue to peach, creating a calming effect.

    Indicative pricing

    Instantly visualize the distributional impact of rate changes across segments to understand who wins, who loses, and why.

    Support strategic planning and regulatory requirements with clear, defensible views of change.

  • Gradient background transitioning from blue to dark blue, conveying a modern feel.

    Underwriter dashboard

    Surface submissions in a dedicated underwriter dashboard with the key attributes, triage outcomes, and supporting details visible upfront.

    Enable quick, confident decisions by reducing document switching and ensuring the most relevant risks and next actions are immediately clear.

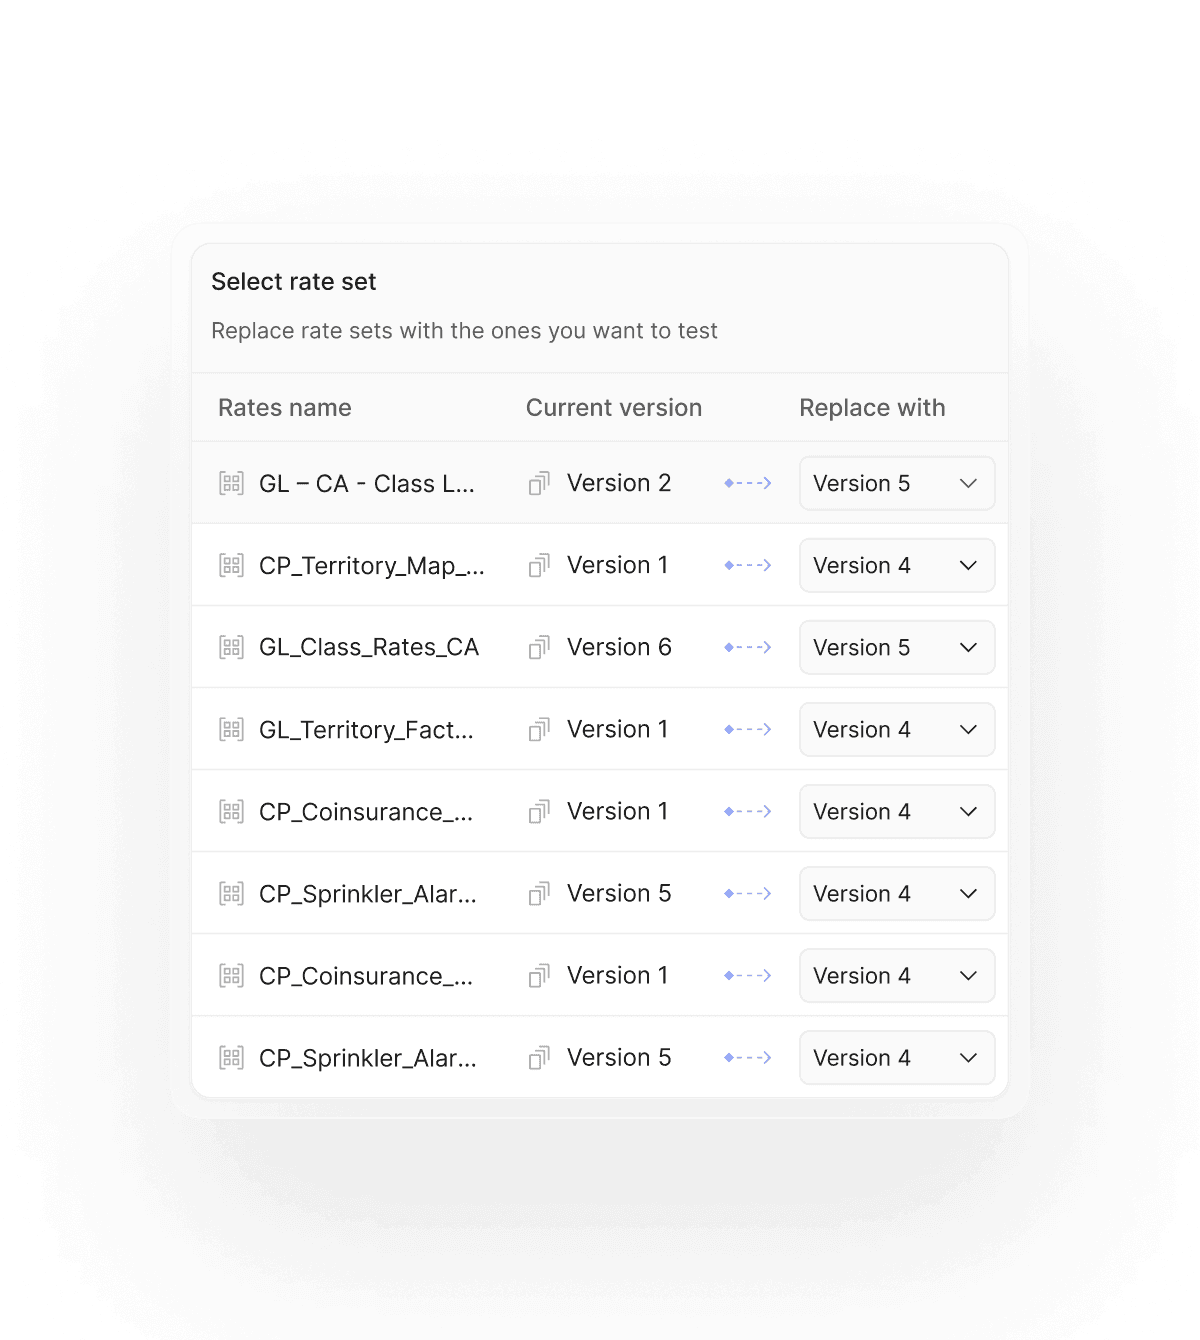
    Rate set selection interface showing current versions and replacement options.
    Abstract gradient background in warm tones, conveying a modern, innovative feel.

    Underwriter dashboard

    Rapidly test, refine, and compare rate updates directly within the batch rating workflow to identify the best pricing approach.

    Shorten iteration cycles by seeing portfolio impacts immediately and adjusting assumptions with precision.

    Rate set selection interface showing current versions and replacement options.
    Abstract gradient background in warm tones, conveying a modern, innovative feel.

    Underwriter dashboard

    Rapidly test, refine, and compare rate updates directly within the batch rating workflow to identify the best pricing approach.

    Shorten iteration cycles by seeing portfolio impacts immediately and adjusting assumptions with precision.

  • Gradient background in warm tones, conveying a sense of innovation and clarity.

    Submission-to-quote insights

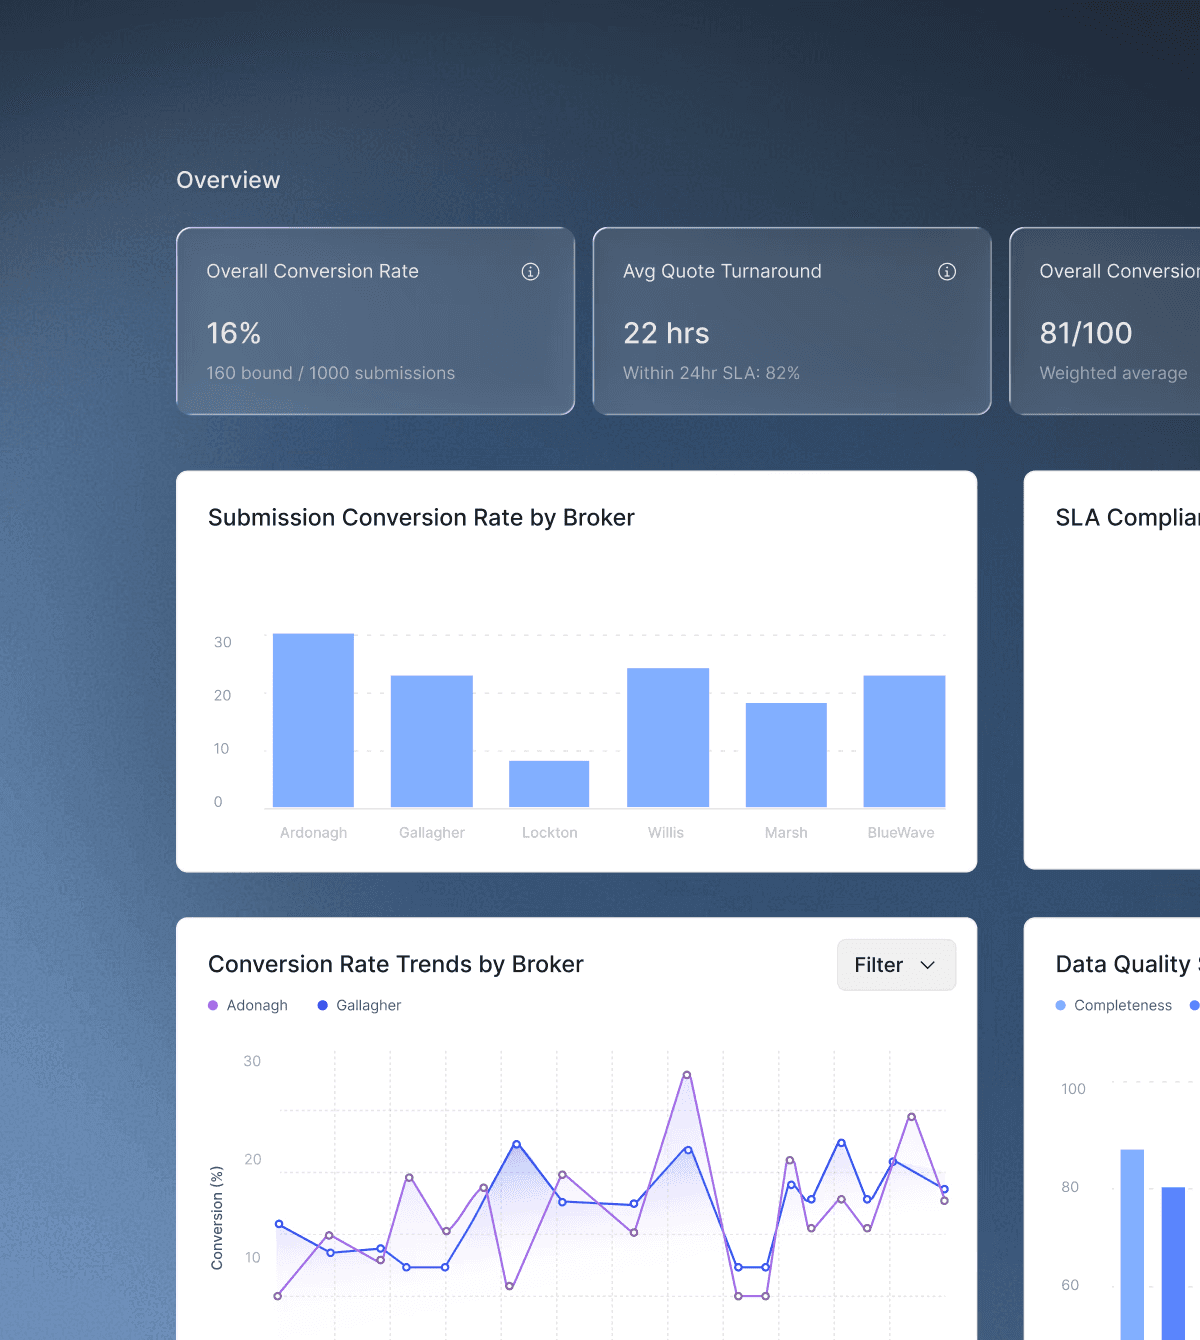
    Capture data across every submission and track progress through quote and bind to create a complete, auditable view of underwriting performance.

    Measure submission-to-quote and submission-to-bind ratios by segment, broker, and channel to identify where process improvements or appetite shifts can unlock additional profitable growth.

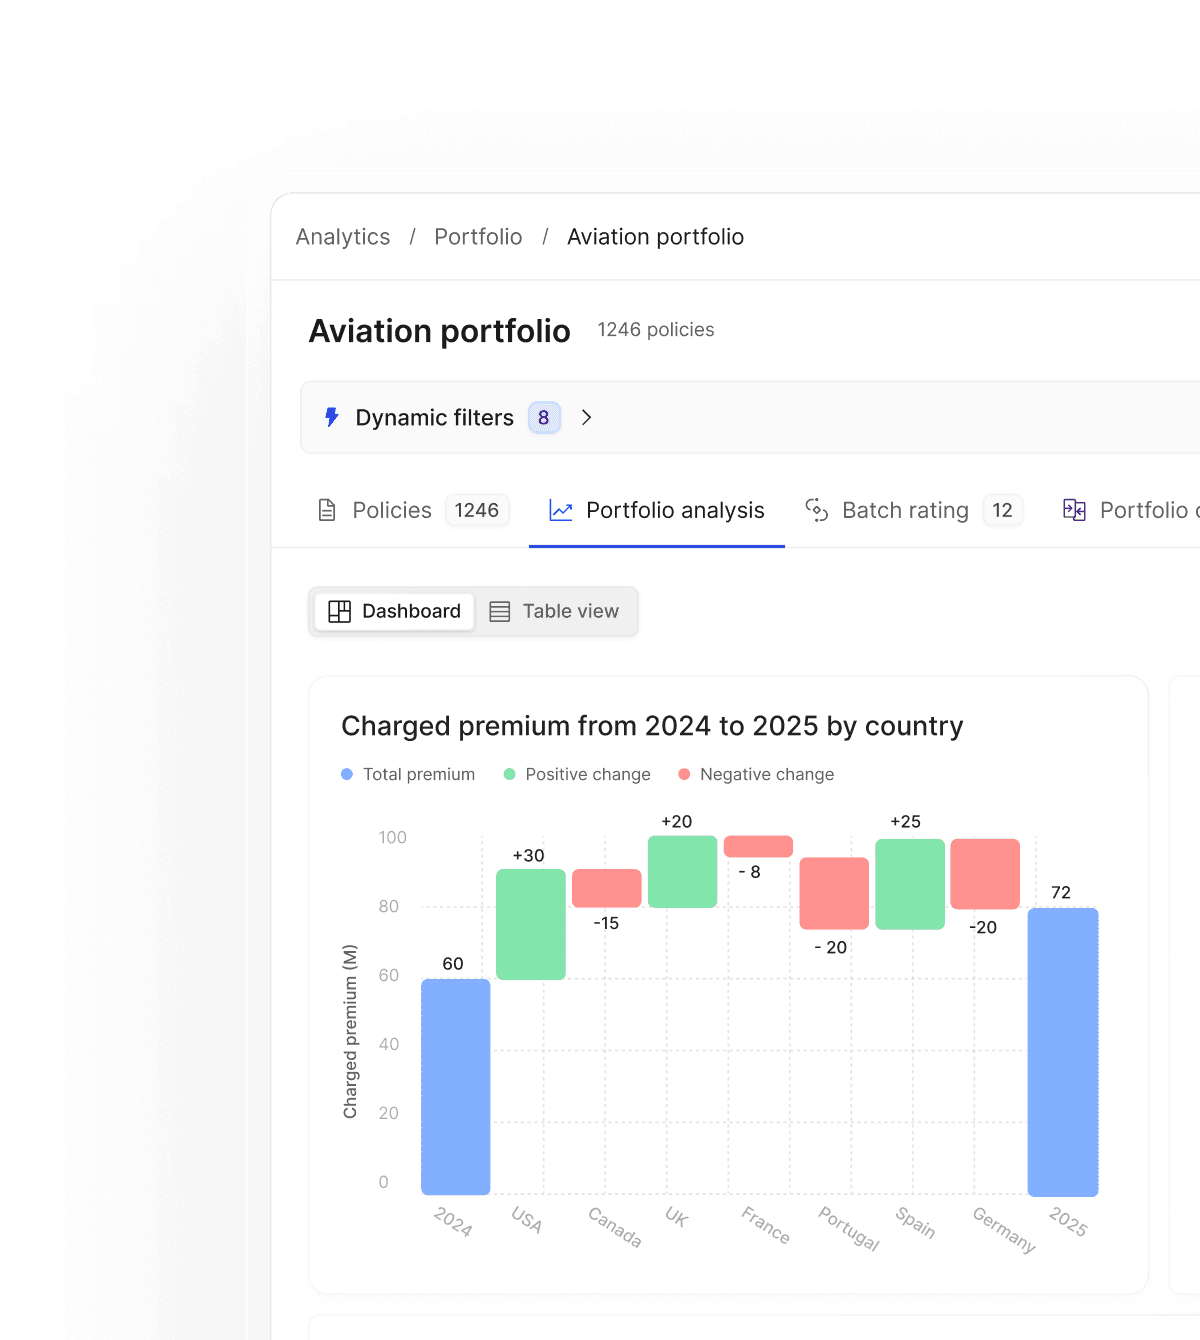
    Bar chart showing charged premiums by country from 2024 to 2025 for aviation.
    Gradient background in warm tones, conveying a sense of innovation and clarity.

    Submission-to-quote insights

    Chain batch runs together to build step-by-step impact views that isolate the effect of each change.

    Reveal underlying portfolio dynamics so teams can explain outcomes clearly and choose the most effective levers.

    Bar chart showing charged premiums by country from 2024 to 2025 for aviation.
    Gradient background in warm tones, conveying a sense of innovation and clarity.

    Submission-to-quote insights

    Chain batch runs together to build step-by-step impact views that isolate the effect of each change.

    Reveal underlying portfolio dynamics so teams can explain outcomes clearly and choose the most effective levers.

  • Gradient background in warm tones, conveying a sense of innovation and clarity.

    Risk appetite optimization

    Run scenario analysis on alternative appetite structures to understand the expected effect on volume, mix, and profitability before making changes.

    Support strategic decisions about where to tighten or loosen appetite with clear projections, so growth initiatives are deliberate, measurable, and aligned with underwriting goals.

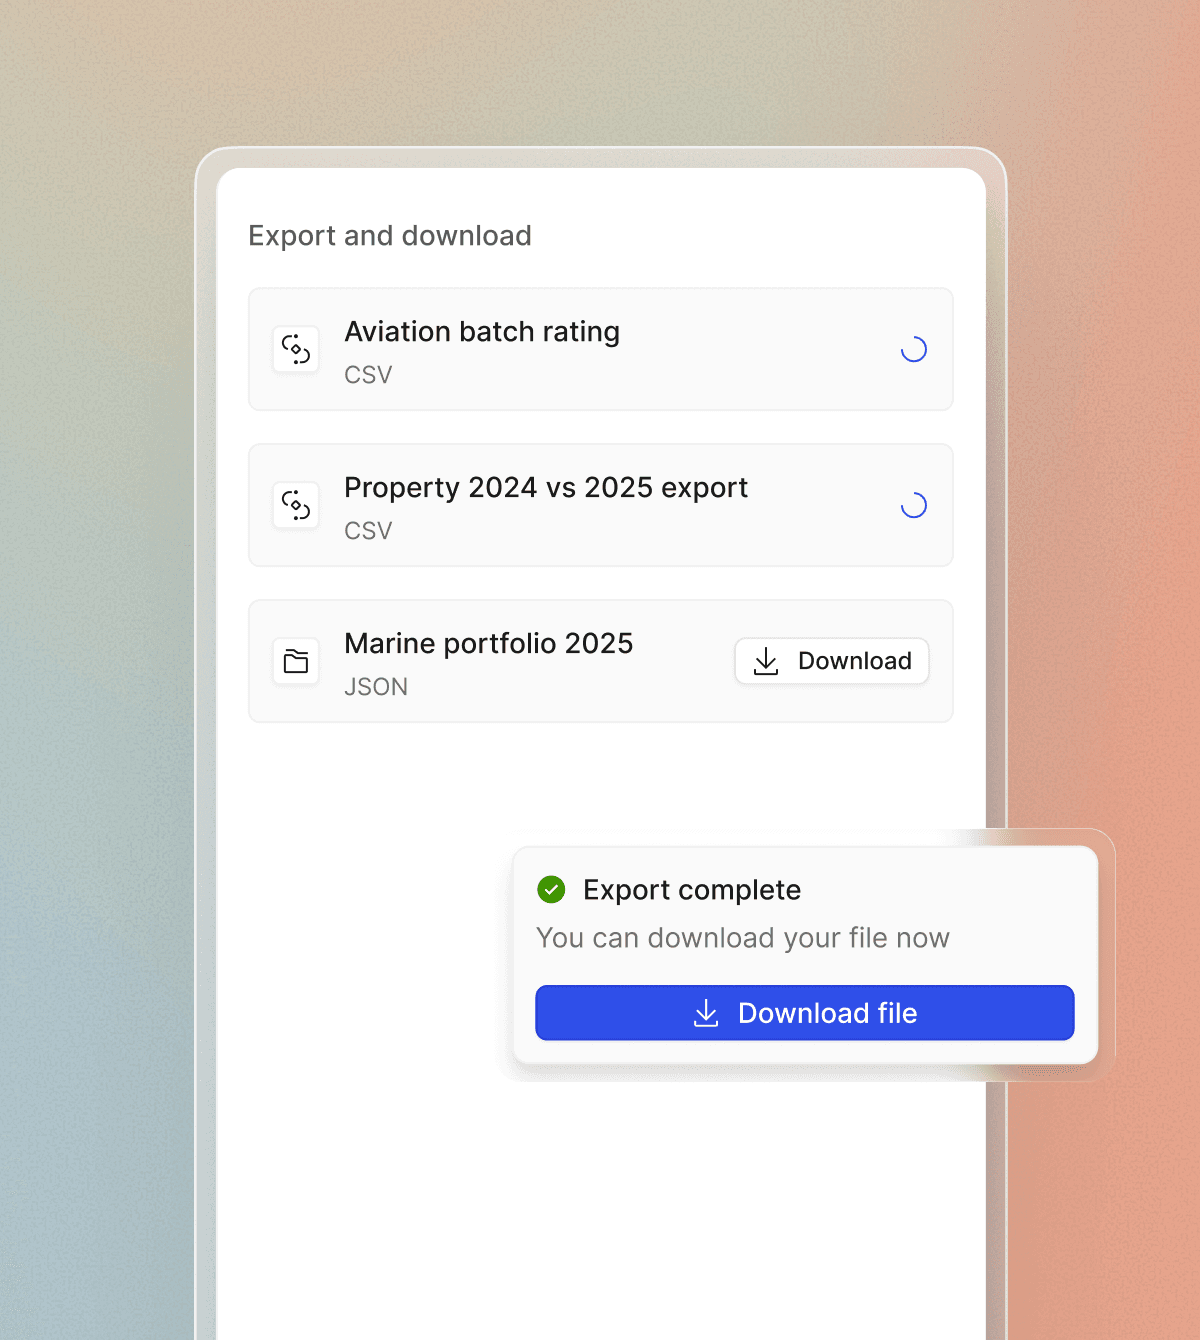
    Export interface displaying completed downloads for various data files.
    Gradient background in warm tones, conveying a sense of innovation and clarity.

    Risk appetite optimization

    Access batch results in-platform or export them to data lakes and warehouses for downstream analysis and reporting.

    Trigger model runs and retrieve outputs via flexible APIs to integrate pricing workflows into your broader data ecosystem.

    Export interface displaying completed downloads for various data files.
    Gradient background in warm tones, conveying a sense of innovation and clarity.

    Risk appetite optimization

    Access batch results in-platform or export them to data lakes and warehouses for downstream analysis and reporting.

    Trigger model runs and retrieve outputs via flexible APIs to integrate pricing workflows into your broader data ecosystem.

Enterprise grade security and compliance

Enterprise Security

SOC2 Type 2 and ISO 27001:2022 certified, with rigorous controls to protect sensitive underwriting data and help you meet enterprise compliance requirements.

Full audit trails & governance

Every decision, rule change, and model update is captured end-to-end - giving you transparency, accountability, and a clear path for regulatory review.

Open, portable, yours

Structured access to all data, configuration, and code, available anytime for full transparency, portability, and operational continuity.


"By partnering with hx, we're making intelligent underwriting a reality for our Global Corporate & Specialty business"

Karen Dayal

Chief Underwriting Officer, Aviva

A woman in a coral dress engages with a camera at a professional event.

"By partnering with hx, we're making intelligent underwriting a reality for our Global Corporate & Specialty business"

Karen Dayal

Chief Underwriting Officer, Aviva

A woman in a coral dress engages with a camera at a professional event.